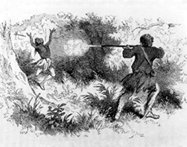
A typical Sunnyvale vampire (Spike) preying on a typical female citizen (Willow).
Brian Dalen Thomas addresses the vexed question of human vampire ecology in the Sunnyvale, California of Joss Wheedon’s Buffy the Vampire Slayer.
Excerpts:
(W)e know from the sign in “Lover’s Walk†that the human population of Sunnydale is 38,500. …
Sunnydale’s human population growth rate is 10% annually, which is certainly at the high end for a budding California community.
A vampire feeds every three days, and encounters about one hundred potential victims in the course of a day, meaning that 1 out of every 300 encounters involves a little refreshment.
An individual vampire sires a victim every other year, or once per 240 feedings.
Buffy and her Slayerettes, busy little beavers that they are, annually stake about 1/3 of the vampires plaguing Sunnydale.
Vampires are flocking to Sunnydale, since the Hellmouth is the underwordly equivalent of Silicon Valley, and the demon labor market is just too good to be true. Thus, we’ll assume a yearly migration rate of about 10%, or the same as for the humans.
A Model
What follows is based on some of the simpler theoretical understandings of predator-prey population dynamics. I’m assuming that human populations are not controlled solely by vampire predation (i.e.- in the absence of vampires, the human population would still eventually be limited by some other factor, like food supply, disease, or access to a well written weekly news magazine. I like The Economist myself, but that’s clearly a digression).
If we let H stand for the size of the human population and V stand for the size of the vampire population, then we can represent the changes in each population over time with a pair of differential equations:
dH/dt = rH (K-H)/K -aHV
dv/dT = baHV + mV – sV
where r is the intrinsic growth rate of the human population, incorporating natural rates of both birth and death as well as immigration
K is the human carrying capacity of the habitat in question
a is a coefficient that relates the number of human-vampire encounters to the number of actual feedings
b is the proportion of feedings in which the vampire sires the victim (i.e.- this is the vampire birth rate)
m is the net rate of vampire migration into Sunnydale
s is the rate at which the Scoobies stake vampires (assumed to be the only important source of vampire deaths).

The following graph shows human population sizes on the horizontal axis and vampire population sizes on the vertical axis. Each line represents a trajectory through time (the tail of each line, scattered around the outer edge of the figure, shows the “initial population size†where we started the model in motion). Any point on a line represents a combination of human and vampire population sizes – a step, if you will, in that beautiful dance between Buffy and the Minions of Evil. Notice that wherever we “start†the trajectories, they all spiral in towards our equilibrium state, indicated in the center by an
asterisk.
Hat tip to Robert M. Breedlove.


Robert M Breedlove
Thanks for the hat tip. I thought it would amuse.
Please Leave a Comment!