Category Archive 'Earth’s Temperature'
23 Jul 2023

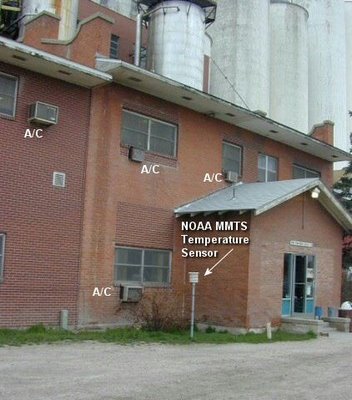
Fort Morgan, Colorado US Historical Climate Network Station. It is easy to see how urbanization can impact recorded temperature data.
BULLSHIT IN THE NEWS link
Issues & Insights identifies the key flaw in the Alarmist narrative.
The United Nation’s Intergovernmental Panel on Climate Change is quite certain Earth will be in trouble if the global temperature exceeds pre-industrial levels by 1.5 degrees Celsius or more. But how can anyone know? According to university research, “global temperature” is a meaningless concept.
“Discussions on global warming often refer to ‘global temperature.’ Yet the concept is thermodynamically as well as mathematically an impossibility,” says Science Daily, paraphrasing Bjarne Andresen, a professor at the University of Copenhagen’s Niels Bohr Institute, one of three authors of a paper questioning the “validity of a global temperature.”
Science Daily explains how the “global temperature” is determined.
“The temperature obtained by collecting measurements of air temperatures at a large number of measuring stations around the globe, weighing them according to the area they represent, and then calculating the yearly average according to the usual method of adding all values and dividing by the number of points.”
But a “temperature can be defined only for a homogeneous system,” says Andresen. The climate is not regulated by a single temperature. Instead, “differences of temperatures drive the processes and create the storms, sea currents, thunder, etc. which make up the climate”.
While it’s “possible to treat temperature statistically locally,” says Science Daily, “it is meaningless to talk about a global temperature for Earth. The globe consists of a huge number of components which one cannot just add up and average. That would correspond to calculating the average phone number in the phone book. That is meaningless.”
There are two ways to measure temperature: geometrically and mathematically. They can produce a large enough difference to show a four-degree gap, which is sufficient to drive “all the thermodynamic processes which create storms, thunder, sea currents, etc.,” according to Science Daily.
So if global temperature is unknowable, how can the IPCC and the entire industry of alarmists and activists be so sure there exists a threshold we cannot pass? Of course the IPCC says it knows the unknowable. In its latest report, released this month, it yet again maintained that the global temperature must “kept to well below 2º C, if not 1.5º C” above pre-industrial levels to avoid disaster.
A few years after the University of Copenhagen report was published, University of Guelph economist Ross McKitrick, one of the report’s authors, noted in another paper that “number of weather stations providing data . . . plunged in 1990 and again in 2005. The sample size has fallen by over 75% from its peak in the early 1970s, and is now smaller than at any time since 1919.”
“There are serious quality problems in the surface temperature data sets that call into question whether the global temperature history, especially over land, can be considered both continuous and precise. Users should be aware of these limitations, especially in policy-sensitive applications.”
RTWT
HT: Mark Tapscott.
Statistics! “There are three kinds of falsehoods, lies, damned lies, and statistics.” –Arthur Balfour.
“If I get to select both the data and the methodology of calculation, I can prove anything with statistics.” –David Zincavage.
————————
Originally posted: 18 August 2019.
18 Aug 2019
Fort Morgan, Colorado US Historical Climate Network Station. It is easy to see how urbanization can impact recorded temperature data.
Issues & Insights identifies the key flaw in the Alarmist narrative.
The United Nation’s Intergovernmental Panel on Climate Change is quite certain Earth will be in trouble if the global temperature exceeds pre-industrial levels by 1.5 degrees Celsius or more. But how can anyone know? According to university research, “global temperature” is a meaningless concept.
“Discussions on global warming often refer to ‘global temperature.’ Yet the concept is thermodynamically as well as mathematically an impossibility,” says Science Daily, paraphrasing Bjarne Andresen, a professor at the University of Copenhagen’s Niels Bohr Institute, one of three authors of a paper questioning the “validity of a global temperature.”
Science Daily explains how the “global temperature” is determined.
“The temperature obtained by collecting measurements of air temperatures at a large number of measuring stations around the globe, weighing them according to the area they represent, and then calculating the yearly average according to the usual method of adding all values and dividing by the number of points.”
But a “temperature can be defined only for a homogeneous system,” says Andresen. The climate is not regulated by a single temperature. Instead, “differences of temperatures drive the processes and create the storms, sea currents, thunder, etc. which make up the climate”.
While it’s “possible to treat temperature statistically locally,” says Science Daily, “it is meaningless to talk about a global temperature for Earth. The globe consists of a huge number of components which one cannot just add up and average. That would correspond to calculating the average phone number in the phone book. That is meaningless.”
There are two ways to measure temperature: geometrically and mathematically. They can produce a large enough difference to show a four-degree gap, which is sufficient to drive “all the thermodynamic processes which create storms, thunder, sea currents, etc.,” according to Science Daily.
So if global temperature is unknowable, how can the IPCC and the entire industry of alarmists and activists be so sure there exists a threshold we cannot pass? Of course the IPCC says it knows the unknowable. In its latest report, released this month, it yet again maintained that the global temperature must “kept to well below 2º C, if not 1.5º C” above pre-industrial levels to avoid disaster.
A few years after the University of Copenhagen report was published, University of Guelph economist Ross McKitrick, one of the report’s authors, noted in another paper that “number of weather stations providing data . . . plunged in 1990 and again in 2005. The sample size has fallen by over 75% from its peak in the early 1970s, and is now smaller than at any time since 1919.”
“There are serious quality problems in the surface temperature data sets that call into question whether the global temperature history, especially over land, can be considered both continuous and precise. Users should be aware of these limitations, especially in policy-sensitive applications.”
RTWT
HT: Mark Tapscott.
Statistics! “There are three kinds of falsehoods, lies, damned lies, and statistics.” –Arthur Balfour.
“If I get to select both the data and the methodology of calculation, I can prove anything with statistics.” –David Zincavage.
02 Feb 2010

Phil Jones
Phil Jones, the former director of the University of East Anglia’s Climatic Research Unit (CRU) who resigned in the wake of the leaked Climategate emails, along with a Chinese-American colleague, Wei-Chyung Wang, of the University at Albany in New York, is the target of a major investigation by the Guardian.
Jones et.al. published a paper in Nature in 1990, addressing concerns that temperature data might be being inflated by the location of sensors in urban locations which dismissed those concerns, assuring readers that he and his colleagues had examined the data and analysed the impact of urban settings, concluding that “The results show that the urbanization influence in two of the most widely used hemispheric data sets is, at most, an order of magnitude less than the warming seen on a century timescale.”
The 1990 Nature paper became a key reference source incorporated in the conclusions of succeeding reports of the Intergovernmental Panel on Climate Change –- including a chapter in the 2007 report of which Phil Jones was a co-author.
Climate skeptics, not surprisingly, found the paper’s conclusion counter-intuitive. Brick, asphalt, and cement absorb and retain heat, and centers of human population and economic activity generate considerable heat as byproducts of the warming and cooling of interior spaces and as the result of transportation and industrial production.
Jones responded to requests for information on the locations of 84 Chinese weather stations used in the study negatively, claiming that supplying that information to critics would be “unduly burdensome.”
Finally, in 2007, Jones responded to continuing pressure by releasing the data he had available, which proved to be startlingly incomplete. 49 of 84 Chinese weather stations had no location histories or other details, including all but 2 of 42 stations listed as “rural.” 18 other stations had been moved, possibly compromising the validity of thie data, including one which had been moved 5 times over a distance of 41 kilometers.
Douglas Keenan, a retired British banker and independent climate analyst, published a paper in the peer-reviewed journal Energy & Environment openly lodging an accusation that fraud had occurred. Keenan’s paper is much discussed in the Climategate emails.
The Guardian has allocated major coverage. 1, 2
————————————————–

Fort Morgan, Colorado US Historical Climate Network Station. It is easy to see how urbanization can impact recorded temperature data.
Your are browsing
the Archives of Never Yet Melted in the 'Earth’s Temperature' Category.
/div>

Feeds
|