Category Archive 'Damned Lies'
18 Mar 2020


John P.A. Ioannidis, professor of medicine, of epidemiology and population health, of biomedical data science, and of statistics at Stanford University and co-director of Stanford’s Meta-Research Innovation Center, warns that, as is very much standard operating procedure in the modern world, we are making serious decisions treating totally unreliable statistics as facts.
The data collected so far on how many people are infected and how the epidemic is evolving are utterly unreliable. Given the limited testing to date, some deaths and probably the vast majority of infections due to SARS-CoV-2 are being missed. We don’t know if we are failing to capture infections by a factor of three or 300. Three months after the outbreak emerged, most countries, including the U.S., lack the ability to test a large number of people and no countries have reliable data on the prevalence of the virus in a representative random sample of the general population.
This evidence fiasco creates tremendous uncertainty about the risk of dying from Covid-19. Reported case fatality rates, like the official 3.4% rate from the World Health Organization, cause horror — and are meaningless. Patients who have been tested for SARS-CoV-2 are disproportionately those with severe symptoms and bad outcomes. As most health systems have limited testing capacity, selection bias may even worsen in the near future.
The one situation where an entire, closed population was tested was the Diamond Princess cruise ship and its quarantine passengers. The case fatality rate there was 1.0%, but this was a largely elderly population, in which the death rate from Covid-19 is much higher.
Projecting the Diamond Princess mortality rate onto the age structure of the U.S. population, the death rate among people infected with Covid-19 would be 0.125%. But since this estimate is based on extremely thin data — there were just seven deaths among the 700 infected passengers and crew — the real death rate could stretch from five times lower (0.025%) to five times higher (0.625%). It is also possible that some of the passengers who were infected might die later, and that tourists may have different equencies of chronic diseases — a risk factor for worse outcomes with SARS-CoV-2 infection — than the general population. Adding these extra sources of uncertainty, reasonable estimates for the case fatality ratio in the general U.S. population vary from 0.05% to 1%.
That huge range markedly affects how severe the pandemic is and what should be done. A population-wide case fatality rate of 0.05% is lower than seasonal influenza. If that is the true rate, locking down the world with potentially tremendous social and financial consequences may be totally irrational. It’s like an elephant being attacked by a house cat. Frustrated and trying to avoid the cat, the elephant accidentally jumps off a cliff and dies.
RTWT
We have a serious problem in the fact that most people, including the overwhelming majority of people in positions of power and responsibility do not understand math and think that statistical estimates and projections constitute scientific fact. How many times have you heard the network news talking head gravely report that “We know there are only [pick a number] of [pick an allegedly Endangered Species] left”?
Only old people like myself remember today the 1976 Swine Flu Epidemic Panic that Gerald Ford presided over which, when the whole thing petered out into a non-event, left the President and official Washington looking ridiculous.
HT: Frank Dobbs.
27 May 2014

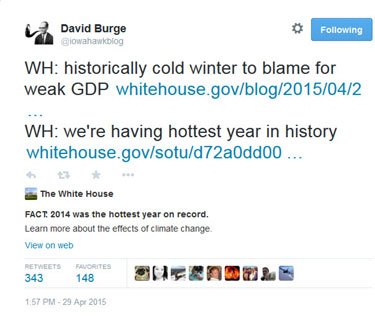
In the Wall Street Journal, Joseph Bast and Roy Spencer look at the evidence, and find that the oft-repeated claim that “97% of climate scientists” subscribe to a belief in Catastrophist Anthropogenic Warmism is just as empty a claim as the newspaper headlines about melting glacier and Polar icecaps.
Last week Secretary of State John Kerry warned graduating students at Boston College of the “crippling consequences” of climate change. “Ninety-seven percent of the world’s scientists,” he added, “tell us this is urgent.”
Where did Mr. Kerry get the 97% figure? Perhaps from his boss, President Obama, who tweeted on May 16 that “Ninety-seven percent of scientists agree: #climate change is real, man-made and dangerous.” Or maybe from NASA, which posted (in more measured language) on its website, “Ninety-seven percent of climate scientists agree that climate-warming trends over the past century are very likely due to human activities.”
Yet the assertion that 97% of scientists believe that climate change is a man-made, urgent problem is a fiction. The so-called consensus comes from a handful of surveys and abstract-counting exercises that have been contradicted by more reliable research.
One frequently cited source for the consensus is a 2004 opinion essay published in Science magazine by Naomi Oreskes, a science historian now at Harvard. She claimed to have examined abstracts of 928 articles published in scientific journals between 1993 and 2003, and found that 75% supported the view that human activities are responsible for most of the observed warming over the previous 50 years while none directly dissented.
Ms. Oreskes’s definition of consensus covered “man-made” but left out “dangerous”—and scores of articles by prominent scientists such as Richard Lindzen, John Christy, Sherwood Idso and Patrick Michaels, who question the consensus, were excluded. The methodology is also flawed. A study published earlier this year in Nature noted that abstracts of academic papers often contain claims that aren’t substantiated in the papers.
Read the whole thing.
14 May 2014
Divorce rate in Maine
correlates with
Per capita consumption of margarine (US)
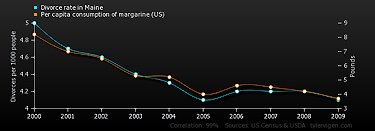
Correlation: 0.992558
Amusing web-site mocks statistical evidence by posting a daily graph and quantitative data demonstrating a meaningless correlation between two totally unconnected collections of events.
Hat tip to Scott Drum.
24 Mar 2014

Judith Levy, editor of Ricochet, went through 175 responses to The Edge’s 2014 inquiry: What scientific idea is ready for retirement?, and selected a few responses offering very likely the best candidate: statistics.
Emanuel Derman, professor of financial engineering at Columbia, wrote that the power of statistics is an idea worth retiring:
…nowadays the world, and especially the world of the social sciences, is increasingly in love with statistics and data science as a source of knowledge and truth itself. Some people have even claimed that computer-aided statistical analysis of patterns will replace our traditional methods of discovering the truth, not only in the social sciences and medicine, but in the natural sciences too.
… Statistics—the field itself—is a kind of Caliban, sired somewhere on an island in the region between mathematics and the natural sciences. It is neither purely a language nor purely a science of the natural world, but rather a collection of techniques to be applied, I believe, to test hypotheses. Statistics in isolation can seek only to find past tendencies and correlations, and assume that they will persist. But in a famous unattributed phrase, correlation is not causation.
Science is a battle to find causes and explanations amidst the confusion of data. Let us not get too enamored of data science, whose great triumphs so far are mainly in advertising and persuasion. Data alone has no voice. There is no “raw” data, as Kepler’s saga shows. Choosing what data to collect and how to think about it takes insight into the invisible; making good sense of the data collected requires the classic conservative methods: intuition, modeling, theorizing, and then, finally, statistics.
…
Science journalist Charles Seife wrote that “statistical significance” is almost invariably misused, to the point that it has become
a boon for the mediocre and for the credulous, for the dishonest and for the merely incompetent. It turns a meaningless result into something publishable, transforms a waste of time and effort into the raw fuel of scientific careers. It was designed to help researchers distinguish a real effect from a statistical fluke, but it has become a quantitative justification for dressing nonsense up in the mantle of respectability. And it’s the single biggest reason that most of the scientific and medical literature isn’t worth the paper it’s written on.
26 Jan 2013

According to US Dept of Health and Human Services
There are roughly 700,000 employed physicians in the U.S
There are roughly 120,000 accidental deaths caused by physician per year
That means there are roughly 0.171 accidental deaths per physician per year
According to the FBI
There are roughly 80, 000, 000 gun owners in the U.S
There are roughly 30,000 gun-related deaths (accidental/non-accidental) per year
That means there are roughly 0.000375 deaths per gun owner per year
David Mamet takes on Gun Control in Newsweek no less:
The Left loves a phantom statistic that a firearm in the hands of a citizen is X times more likely to cause accidental damage than to be used in the prevention of crime, but what is there about criminals that ensures that their gun use is accident-free? If, indeed, a firearm were more dangerous to its possessors than to potential aggressors, would it not make sense for the government to arm all criminals, and let them accidentally shoot themselves?
Read the whole thing.
28 Dec 2012

One of my Yale classmates yesterday forwarded this New York Times editorial denouncing the National Rifle Association’s efforts to prevent sophistors, economists, calculators, and “leading experts” on violence from artfully collecting data and massaging statistics in order to produce a scientific, apparently empirical case favoring gun control.
Why would the naughty NRA oppose data collection and scientific research by well-credentialed experts?
The NRA sensibly opposes these so-called empirical studies because it knows that when you get to establish the principles used for collecting data and the methodologies employed in arranging the assembled information and evaluating the results, you possess the ability to prove any case you want to prove, empirically. The NRA knows that figures lie and liars figure, and that there are lies, damned lies, and statistics.
Where does such empiricism lead? Just look at Britain where conventional pocket knives are banned as “offensive weapons” and “leading experts” have been calling in recent years for a ban on pointed kitchen knives.
[Accident & Emergency] doctors are calling for a ban on long pointed kitchen knives to reduce deaths from stabbing.
A team from West Middlesex University Hospital said violent crime is on the increase – and kitchen knives are used in as many as half of all stabbings.
They argued many assaults are committed impulsively, prompted by alcohol and drugs, and a kitchen knife often makes an all too available weapon.
The research is published in the British Medical Journal.
The researchers said there was no reason for long pointed knives to be publicly available at all.
They consulted 10 top chefs from around the UK, and found such knives have little practical value in the kitchen.
None of the chefs felt such knives were essential, since the point of a short blade was just as useful when a sharp end was needed.
The researchers said a short pointed knife may cause a substantial superficial wound if used in an assault – but is unlikely to penetrate to inner organs.
——————
They won’t stop with taking away our guns. As the example of Britain shows, they will go to the most absurd lengths in criminalizing innocent and harmless possession of marginal examples of weapons in their fanatical pursuit of the elimination of every kind of risk and hazard by the calculative power of human reason operating through the coercive agency of the state.
A disabled caravanner who kept a penknife in his glove compartment to use on picnics has blasted the authorities after being dragged through court for possessing an offensive weapon.
Rodney Knowles, 61, walks with the aid of a stick and had used the Swiss Army knife to cut up fruit on picnics with his wife.
Knowles yesterday admitted possessing an offensive weapon at Torquay Magistrates Court. He was given a conditional discharge.
But speaking after the hearing, he said: ‘It’s a stupid law. Now I have a criminal record.’
12 May 2011

Joe Queenan does a fine job of mocking the federal government’s “core inflation rate” calculation methodology.
[I]magine my surprise when the latest economic data came out and we were told that inflation wasn’t much of a problem at all. The price index for core personal consumption expenditures increased a piddling 0.9% from the previous year, keeping the national inflation rate far, far below what economists see as the danger level.
Hang on a second, I thought: What about my exorbitant fuel costs and the two bucks for my disgusting coffee and the $1.25 for my stale, tasteless bagel, with no schmear, no butter, no nothing? If inflation had jumped just a puny 0.9% in the past 12 months, why did it feel like everything that I bought last week had gone up 25%?
The answer lies in the way economists calculate what they call “core” price indexes. The core personal consumption expenditures index (PCE), for example, computes the cost of a representative basket of goods that consumers might buy—like used copies of “Madden 2009” and lace camisoles and jumbo-size containers of Percocet and personally autographed Kenny Chesney guitar picks and Blu-ray discs of “AVP: Alien vs. Predator” —but it cuts out variables like food and energy prices. This makes the month-to-month reporting on inflation less volatile, far less subject to the vicissitudes of the market.
At first glance, this seems baffling. Removing fuel and food costs from the index purely for the sake of statistical balance seems a bit like saying, “All told, four million people died in World War II. Well, unless you include the people who died in concentration camps. And, oh yeah, the 20 million Russians.” It’s a bit like saying, “On average, a major league baseball team will win 3.2 World Series each century. Obviously, not the Cubs. And we’ve thrown out the New York Yankees and their 27 world championships because it doesn’t provide a true snapshot of the game at any given moment.” It’s a bit like saying, “Billy Joel never wrote a single song that just totally sucks and makes people’s skin crawl. Unless you include ‘Captain Jack.’ Which we deliberately left out of our sample because it skews the results. Maybe we should have left out ‘Piano Man,’ too.”
Read the whole thing.
03 Mar 2011
Iowahawk catches Paul Krugman lying with figures and nails his slimy hide to the barn door.
Please pardon this brief departure from my normal folderol, but every so often a member of the chattering class issues a nugget of stupidity so egregious that no amount of mockery will suffice. Particularly when the issuer of said stupidity holds a Nobel Prize.
Case in point: Paul Krugman. The Times’ staff economics blowhard recently typed, re the state of education in Texas:
And in low-tax, low-spending Texas, the kids are not all right. The high school graduation rate, at just 61.3 percent, puts Texas 43rd out of 50 in state rankings. Nationally, the state ranks fifth in child poverty; it leads in the percentage of children without health insurance. And only 78 percent of Texas children are in excellent or very good health, significantly below the national average.
Similarly, The Economist passes on what appears to be the cut-‘n’-paste lefty factoid du jour:
Only 5 states do not have collective bargaining for educators and have deemed it illegal. Those states and their ranking on ACT/SAT scores are as follows:
South Carolina – 50th
North Carolina – 49th
Georgia – 48th
Texas – 47th
Virginia – 44th
If you are wondering, Wisconsin, with its collective bargaining for teachers, is ranked 2nd in the country.
The point being, I suppose, is that unionized teachers stand as a thin chalk-stained line keeping Wisconsin from descending into the dystopian non-union educational hellscape of Texas. Interesting, if it wasn’t complete bullshit. …
[A] state’s “average ACT/SAT” is, for all intents and purposes, a proxy for the percent of white people who live there. In fact, the lion’s share of state-to-state variance in test scores is accounted for by differences in ethnic composition. Minority students – regardless of state residence – tend to score lower than white students on standardized test, and the higher the proportion of minority students in a state the lower its overall test scores tend to be.
Please note: this has nothing to do with innate ability or aptitude. Quite to the contrary, I believe the test gap between minority students and white students can be attributed to differences in socioeconomic status. And poverty. And yes, racism. And yes, family structure. Whatever combination of reasons, the gap exists, and it’s mathematical sophistry to compare the combined average test scores in a state like Wisconsin (4% black, 4% Hispanic) with a state like Texas (12% black, 30% Hispanic). …
So how does brokeass, dumbass, redneck Texas stack up against progressive unionized Wisconsin?
2009 4th Grade Math
White students: Texas 254, Wisconsin 250 (national average 248)
Black students: Texas 231, Wisconsin 217 (national 222)
Hispanic students: Texas 233, Wisconsin 228 (national 227)
2009 8th Grade Math
White students: Texas 301, Wisconsin 294 (national 294)
Black students: Texas 272, Wisconsin 254 (national 260)
Hispanic students: Texas 277, Wisconsin 268 (national 260)
2009 4th Grade Reading
White students: Texas 232, Wisconsin 227 (national 229)
Black students: Texas 213, Wisconsin 192 (national 204)
Hispanic students: Texas 210, Wisconsin 202 (national 204)
2009 8th Grade Reading
White students: Texas 273, Wisconsin 271 (national 271)
Black students: Texas 249, Wisconsin 238 (national 245)
Hispanic students: Texas 251, Wisconsin 250 (national 248)
2009 4th Grade Science
White students: Texas 168, Wisconsin 164 (national 162)
Black students: Texas 139, Wisconsin 121 (national 127)
Hispanic students: Wisconsin 138, Texas 136 (national 130)
2009 8th Grade Science
White students: Texas 167, Wisconsin 165 (national 161)
Black students: Texas 133, Wisconsin 120 (national 125)
Hispanic students: Texas 141, Wisconsin 134 (national 131)
To recap: white students in Texas perform better than white students in Wisconsin, black students in Texas perform better than black students in Wisconsin, Hispanic students in Texas perform better than Hispanic students in Wisconsin.
03 May 2010
Yesterday, our friend Bird Dog at Maggie’s Farm linked the generally admirable Clarice Feldman at American Thinker who was editorializing from the perspective opposite to my own on immigration.
Ms. Feldman quoted some alarming, and authoritative sounding, statistics from “the Law Enforcement Examiner.”
On April 7, 2007, the US Justice Department issued a report on criminal aliens that were incarcerated in federal and state prisons and local jails.
In the population study of 55,322 illegal aliens, researchers found that they were arrested at least a total of 459,614 times, averaging about 8 arrests per illegal alien. Nearly all had more than 1 arrest. Thirty-eight percent (about 21,000) had between 2 and 5 arrests, 32 percent (about 18,000) had between 6 and 10 arrests, and 26 percent (about 15,000) had 11 or more arrests. Most of the arrests occurred after 1990.
They were arrested for a total of about 700,000 criminal offenses, averaging about 13 offenses per illegal alien. One arrest incident may include multiple offenses, a fact that explains why there are nearly one and half times more offenses than arrests. Almost all of these illegal aliens were arrested for more than 1 offense. Slightly more than half of the 55,322 illegal aliens had between 2 and 10 offenses.
More than two-thirds of the defendants charged with an immigration offense were identified as having been previously arrested. Thirty-six percent had been arrested on at least 5 prior occasions; 22%, 2 to 4 times; and 12%,1 time.
Clarice Feldman ought to have inquired a little more more closely.
“The Law Enforcement Examiner” is actually an editorialist named Jim Kouri. Mr. Kouri’s biography identifies him as a former chief security guard at a housing project in Washington Heights and the “fifth vice-president of the National Association of Chiefs of Police” which, I expect, must be roughly on a par with being First Guard of the Tent at one’s local International Order of Oddfellows chapter.
Mr. Kouri is renowned on the Internet for his expertise on Satanism and for the exoticism of the views of some sources he has in the past relied upon.
Unfortunately, Mr. Kouri is not himself a reliable source. He tells us that his statistics come from “a report on criminal aliens that were incarcerated in federal and state prisons and local jails” issued by the US Justice Department on April 7, 2007.
It is not accidental that Mr. Kouri does not link the original report.
The report in question was really released on May 9, 2005. It is GAO report number GAO-05-646R entitled ‘Information on Certain Illegal Aliens Arrested in the United States.’
The figures cited all pertain to 2002-2003. Mr. Kouri (and the study’s authors) deliberately selected the best figures for making certain kinds of arguments in the quoted paragraphs.
In reality, this study pertains to 55,322 individual illegal aliens who are the portion of the illegal alien population that wound up arrested, convicted, and sentenced to jail.
55,322 out of the seven million illegal aliens estimated to be present in the United States by this same study is the 0.0079 portion of that illegal immigrant population, well under 1%.
And the character of their crimes?
Forty-five percent of illegal alien offenses were for drugs and immigration;
8% for Traffic violations;
7% for Obstruction of Justice.
60% of the under 1% of illegals in jail in 2002-2003 were not even in jail for any form of theft or violence.
And, more recently, both illegal immigration and violent crime have actually been declining (even while la patrie est en danger reports are dramatically increasing).
CNN:
[S]tatistics from the U.S. Customs and Border Protection agency and the FBI indicate that both the number of illegal crossers and violent crime in general have actually decreased in the past several years.
According to FBI statistics, violent crimes reported in Arizona dropped by nearly 1,500 reported incidents between 2005 and 2008. Reported property crimes also fell, from about 287,000 reported incidents to 279,000 in the same period. These decreases are accentuated by the fact that Arizona’s population grew by 600,000 between 2005 and 2008.
According to the nonpartisan Immigration Policy Institute, proponents of the bill “overlook two salient points: Crime rates have already been falling in Arizona for years despite the presence of unauthorized immigrants, and a century’s worth of research has demonstrated that immigrants are less likely to commit crimes or be behind bars than the native-born.”
If we really looked at the facts, we could only conclude that illegal immigration is not the same thing as narcotics smuggling and, by and large, illegal immigrants tend to be more law-abiding and less violent than us native-born Americans. The public panic and the draconian laws represent responses to misinformation, commonly disseminated by sensationalizing journalists.
Look at AP and Matt Drudge yesterday. or check today’s Wall Street Journal, which blares Killing Stokes Immigration Debate, in reference to Deputy Puroll getting slightly grazed in a minor skirmish with marijuana smugglers. Nobody got killed, and the incident had nothing to with illegal immigration.
19 Mar 2010
Megan McArdle critiques the Congressional Budget Office’s estimate of the cost of Obamacare.
Thanks to reconciliation instructions, they needed to improve the budget impact by at least $1 billion in the sidecar. They improved it by exactly $1 billion. Which goes back to what I’ve now said several times: the CBO process has now been so thoroughly gamed that it’s useless. …
The proposed changes increase spending dramatically, most heavily concentrated in the out-years. The gross cost of the bill has risen from $875 billion to $940 billion over ten years–but almost $40 billion of that comes in 2019. The net cost has increased even more dramatically, from $624 billion to $794 billion. That’s because the excise tax has been so badly weakened. This is of dual concern: it’s a financing risk, but it also means that the one provision which had a genuine shot at “bending the cost curve” in the broader health care market has at this point, basically been gutted. Moreover, it’s hard not to believe that the reason it has been moved to 2018 is that no one really thinks it’s ever going to take effect. It’s one thing to have a period of adjustment. But a tax that takes effect in eight years is a tax so unpopular that it has little realistic chance of being allowed to stand. …
As I expected, the size of the magic asterisk–the modern equivalent of David Stockman’s infamous “savings to be named later” in the Reagan budgets–has had to be beefed up to offset the new spending. …
[A]re we really going to cut Medicare? If we’re not, this gargantuan new entitlement is going to end up costing us about $200 billion a year next decade, which even in government terms is an awful lot of money. There are offsetting taxes, but they’re either trivial or likely to be unpopular–look forward to a 4% rent increase when your landlord has to stump over the same amount for the new tax on rents. Then look forward to repeal of same.
I think this is a fiscal disaster waiting to happen. But no one on the other side cares, so I’m not sure how much point there is in saying that any more.
04 Apr 2009
Matthew Vadum, at American Spectator, notes that Barack Obama has selected as Director of the Census the most partisan possible figure, a leftwing sociologist previously involved in democrat efforts to supplement real enumeration with creative estimates of supposedly uncountable homeless and minority democrat voters.
A practitioner of the statistical voodoo known as “sampling” has been selected by President Obama to head the Census Bureau, which is poised to carry out the decennial census next year with ACORN’s help. Liberal pressure groups and Democrats have long favored using statistical modeling, a practice controversial because it’s flagrantly unconstitutional and because it opens up the counting process to political manipulation.
“A sampling process would open the census to the worst kind of political manipulation,” Sen. Tom Coburn (R-Oklahoma) recently said. “The Constitution clearly requires a count of every person, not a best guess that could be influenced by political rather than empirical considerations.”
The president’s nominee is Robert M. Groves, a professor of the alleged discipline known as sociology at the University of Michigan.
Republican lawmakers are justifiably alarmed, the New York Times reports.
Some news agency story.
Your are browsing
the Archives of Never Yet Melted in the 'Damned Lies' Category.
/div>

Feeds
|